Statistics Lab · Twenty Backtests
Twenty Backtests Strategy Guide
Decide which of a book of backtested strategies - if any - deserves funding, once you account for how many were tried to find the winner.
What is overfitting / backtesting bias?
Overfitting happens when a model, or a trading strategy, is tuned so closely to one particular sample of data that it captures the noise in that sample along with any real pattern. Fit a rule with enough free parameters, or search over enough variations, and it will eventually explain the historical data almost perfectly, because with enough flexibility something will always fit past events, including their accidents.
Backtesting bias is the specific version of this problem that shows up whenever a strategy is judged by how well it would have performed on historical data. If you test one strategy once, a strong backtest is meaningful evidence. If you test hundreds of variants and report only the best one, the result stops being a test of that strategy and becomes the outcome of a search, and the search itself manufactures impressive-looking results even when every variant has zero true edge, purely because you kept the winner and discarded the rest.
The statistics of this are captured by order statistics: the maximum of many independent noisy draws is systematically larger than any single draw, and it grows with how many draws you took. Picking the best of twenty coin-flip strategies produces an expected best result well above zero even though the true average is exactly zero - the size of that gap is predictable and can be computed, which is what lets you tell whether an observed 'winner' is doing anything more than being the biggest number in a pile of noise.
This is the same failure mode behind the replication crisis in experimental science: a hypothesis that looked strong after researchers tried many specifications, controls, or subgroups often evaporates when tested on fresh data, because the original result was partly the product of the search. The standard defenses are the same everywhere it appears - hold out data the search never touched, test the winner out of sample, and adjust your standard for what counts as 'impressive' by how large the search was.
The general lesson extends past finance and science: any process that selects a winner from a larger pool - a fund manager from a peer group, a hire from a stack of resumes, a headline from a wave of studies - needs to account for the size of that pool before treating the winner's apparent quality at face value.
How it works
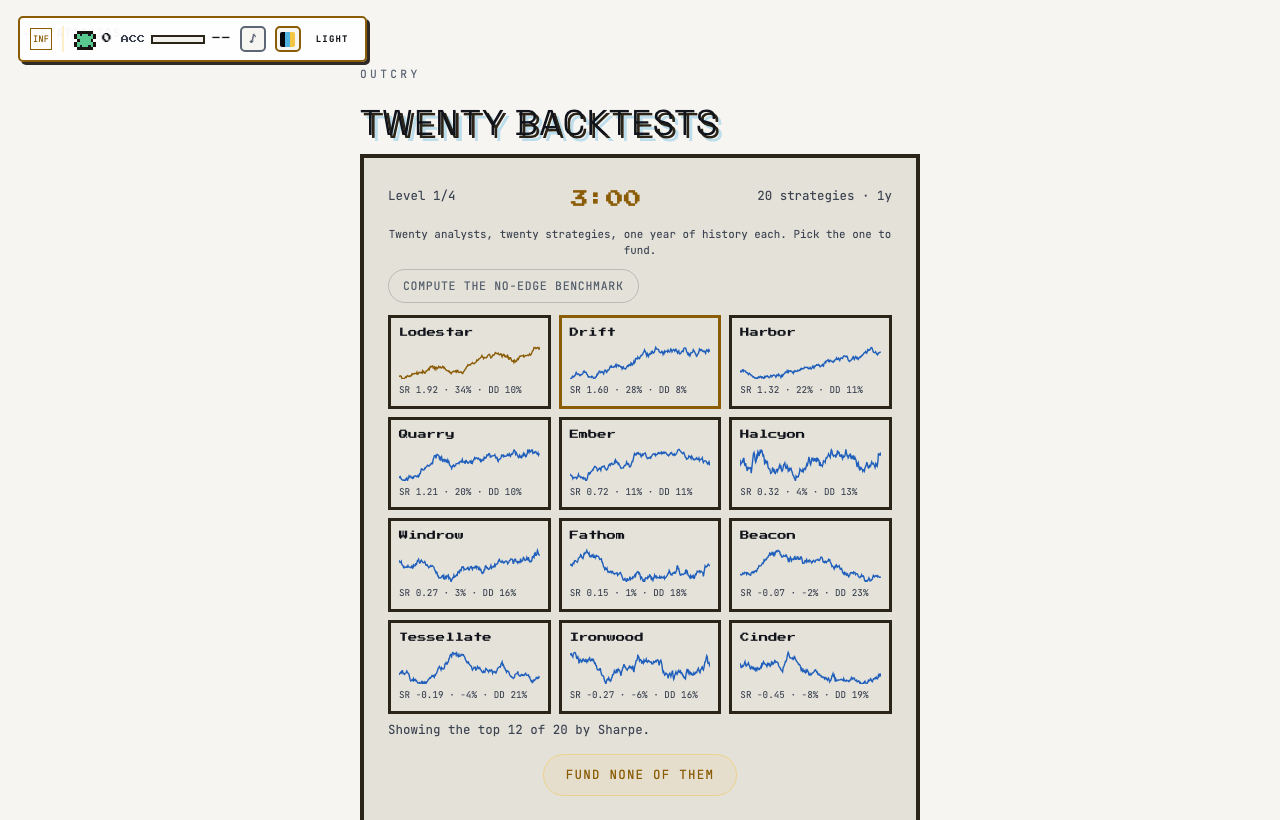
Each of four levels hands you a book of backtested strategies - equity curves, in-sample Sharpe ratios, total returns, and max drawdowns - and one question: which one do you fund? The levels vary the three things that decide the answer: how many strategies were tried (20 or 50), how much history each has (1, 2, or 5 years of daily returns), and whether any strategy genuinely has an edge. In two of the levels every single strategy is pure noise, and the correct answer is to fund nothing.
Each strategy's daily returns are drawn at 1% daily volatility with a drift implied by its true annualised Sharpe, which is zero for all but at most one hidden strategy per level. The winners that look seductive got there by being the best of many. Each level runs on a 3-minute clock; letting it expire counts as declining to fund.
Before deciding, you can press one button to compute the no-edge benchmark: the Sharpe standard error at this history length, the expected best-of-N Sharpe if every strategy were pure noise, the best Sharpe actually observed, and the gap between them in standard-error units, with a three-band verdict (clearly beyond luck / suggestive / in line with luck). After you choose, the level reveals the truth and shows your pick's out-of-sample performance.
How scoring works
Picking the genuinely edged strategy scores 250. Declining to fund when everything is noise scores 200 (including on a timeout). Declining when a real edge existed scores 40 - too cautious, but cheaper than funding noise. Funding a no-edge strategy scores 0.
Your total across the four levels goes to the leaderboard, and the final banner shows a win at 600 or more points.
The Sharpe ratio has error bars
An annualised Sharpe estimated from T daily observations has a standard error of roughly the square root of (252 / T). One year of data (252 days) gives SE near 1.0 - which means a backtested Sharpe of 1.0 over one year is about one standard error from zero, statistically indistinguishable from no edge at all. Two years brings the SE to about 0.71, five years to about 0.45.
This single number reframes every equity curve in the book. A Sharpe of 1.8 on one year is 1.8 SEs from zero before any selection adjustment - some evidence, far from proof. The same 1.8 on five years is 4 SEs from zero, a completely different claim. Always convert the history length to a standard error before letting a Sharpe impress you.
It also explains the level design: more data shrinks the noise floor. The five-year level hides a true Sharpe of only 1.0, and it is still the most detectable edge in the game because the standard error is small enough for it to stand out.
The expected maximum: what winning proves when everyone is guessing
Run N zero-edge strategies and rank them; the best one is not average, it is the maximum of N noisy draws. For N draws from a normal with standard deviation SE, the expected maximum is approximately SE times the normal quantile at (N - 0.375) / (N + 0.25) - Blom's approximation for order statistics, which the game uses because the cruder sqrt(2 ln N) formula overshoots badly at N = 20 (2.45 versus the true 1.87).
Concretely: 20 strategies on one year of data (SE = 1.0) produce an expected best Sharpe of about 1.87 on luck alone. Fifty strategies push it higher still, and the game's 50-strategy level exists exactly to show that widening the search raises the bar for believing the winner. The benchmark for 'is the best one good?' is the expected best under the null.
So the decision rule is: compute the benchmark, subtract it from the best observed Sharpe, and measure the gap in SE units. The game's own verdict bands are a sensible calibration: a gap above 0.75 SE is worth funding, below 0.25 SE is luck-shaped, and the middle is ambiguous - the maximum of N draws has its own sampling spread, so a razor-thin edge over the benchmark proves little.
Asymmetric payoffs favour scepticism
Look at the scoring as a payoff matrix. Declining always pays something: 200 when you are right that it is all noise, 40 even when a real edge slipped past you. Funding pays 250 when right and 0 when wrong. If your read of the benchmark says the winner is only marginally above the no-edge expectation, declining has the better expected value across most of your uncertainty - the game's payoffs mirror the real asymmetry that funding noise costs more than missing one edge.
Fund only on a clear gap. On levels where an edge exists, the generator gives it a true Sharpe well above what its history's noise floor would produce (2.2 on two years, 1.0 on five years), so when the edged strategy is detectable it tends to separate visibly from the pack. A winner sitting a fraction of an SE above 19 noise strategies is exactly what pure selection produces.
Also resist the non-Sharpe seductions. Total return and drawdown are shown because they are what fools people: a lucky noise strategy compounds into a lovely curve. The out-of-sample reveal after each choice is the recurring lesson - in-sample winners with no edge collapse toward zero out of sample, because the luck that selected them does not repeat.
A worked example
Level 1: twenty strategies (N = 20), one year of daily history each (T = 252 days), and a best observed Sharpe of:
The standard error of an annualised Sharpe estimated from T daily observations is approximately:
With one year of data, T = 252, so the noise floor is exactly:
The best of N zero-edge strategies is the maximum of N noisy draws. Blom's approximation gives its expected value:
For N = 20, the quantile index is (20 - 0.375)/(20.25) ≈ 0.969, whose normal quantile is about 1.87:
Compare the best observed Sharpe to this benchmark:
A gap of 0.18 SE is deep in the 'in line with luck' band, so the correct call is to fund none of them, for 200 points. Contrast level 4, where five years of history (1260 days) drops the noise floor and the expected best-of-20 with it - there, an observed Sharpe of 1.5 to 2 clears the benchmark by several SEs, and funding it scores 250:
Common mistakes
• Skipping the benchmark button. The whole decision is best-observed versus expected-best-under-noise, and the game computes both for you - deciding from the raw Sharpe table is deciding blind.
• Anchoring on 'Sharpe above 1 is good'. A threshold that ignores history length and search width is meaningless: 1.0 on one year is noise-sized, 1.0 on five years is interesting.
• Being seduced by total return and smooth equity curves. Noise compounds too; the sparkline of a lucky strategy is indistinguishable from skill by eye.
• Never declining. Two of the four levels contain nothing real, and 'fund none' is the top-scoring answer there.
• Forgetting that widening the search raises the bar. Fifty candidates push the luck-only expected maximum well above twenty candidates' - the same observed Sharpe is weaker evidence in a bigger bake-off.
Why interviews test this
Multiple testing and backtest overfitting are core interview territory for quant research seats and increasingly for risk and allocator roles. Classic prompts: 'An analyst shows you a Sharpe 2 backtest - what do you ask?' (how much data, how many variants were tried, what does out-of-sample look like), 'What is the standard error of a Sharpe ratio?' (roughly sqrt(252/T) annualised from daily data), and 'What does the best of N random strategies look like?' (an order-statistics question - the expected maximum grows with N even when every strategy is worthless).
The deeper skill being tested is selection-aware thinking: any time you see a winner - a strategy, a fund, a published result - the first question is how big the pool it was selected from was. Interviewers use this to separate candidates who evaluate evidence from candidates who evaluate performance.
Play Twenty Backtests on Outcry
Twenty Backtests is free to play on Outcry, in the Statistics Lab section, and every run is timed and scored. Read the guide once, then play Twenty Backtests and check your score against the strategy above. The guide book has a written guide for every other game, and the practice hub and mock assessments put the same skills under a real screen's clock.