Drill Lab · Likelihood Ranking
Likelihood Ranking Strategy - Order by Probability
Order outcomes from most to least likely - student score tables, distributions, dice and card events, Poisson arrivals, urns, and scatter plots.
What is likelihood/probability ranking?
Likelihood ranking is the skill of ordering a set of outcomes or events by how probable they are, without necessarily computing an exact probability for any of them. Ordering is a weaker task than calculation - it only requires knowing which of two things is more likely - but it still demands an understanding of probability beyond arithmetic.
It is a trainable skill because many probability judgments need only a correct comparison, and training the intuition behind comparisons - which event dominates another, how a distribution's shape concentrates probability, how to count favorable outcomes - transfers further than training exact computation for every scenario. Judgment-and-decision-making research draws the same line between ordinal judgment (which is more likely) and cardinal judgment (how likely), and the two do not require the same training.
The reasoning tools involved recur across very different-looking problems: dominance arguments, where one event is a strict subset of another and therefore can be no more likely; knowledge of distribution shape, where probability concentrates near the mode and falls off in the tails; and basic counting of favorable outcomes over a sample space, as with dice or cards. These are a small, reusable toolkit, which is what makes the skill generalize.
Interviewers test it because reasoning about likelihood quickly and without a calculator reveals whether a candidate has intuition for probability or only the ability to plug numbers into a formula they were taught. A ranking task probes whether that intuition is fast and reliable enough to use in real time, which is closer to how probabilistic judgment gets used in trading and risk decisions than a slow, worked calculation.
How it works
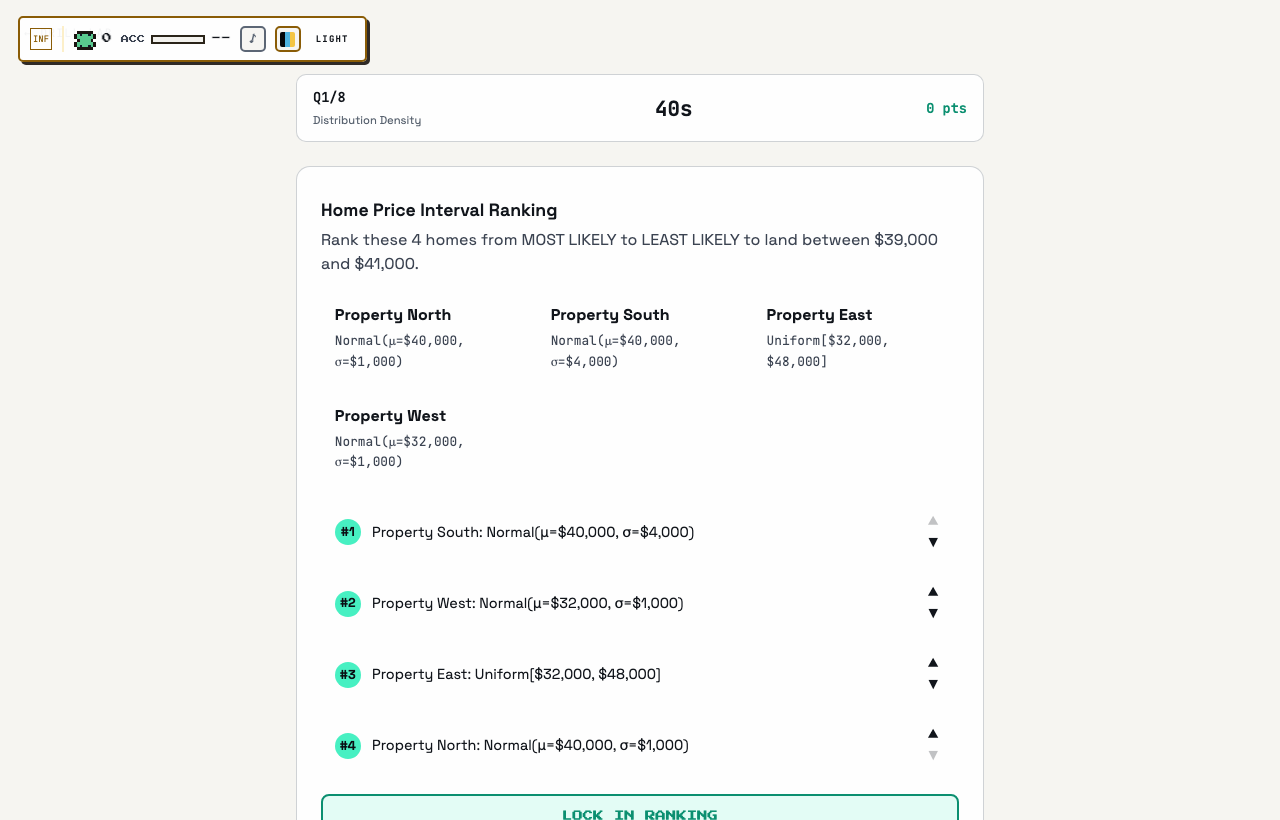
Each round is 8 questions. A question presents a scenario - a table of student test scores, a set of distribution statements, dice/card/urn events, Poisson arrival counts, or a labelled scatter plot - and a shuffled list of options to arrange from MOST LIKELY to LEAST LIKELY. You reorder the list with up/down move buttons, then submit; the reveal shows the correct order and your pairwise agreement before the next question.
Every question has its own time limit, shown as a countdown - when it hits zero your current arrangement is submitted as-is, so a half-sorted list still earns whatever partial credit it deserves. The pool mixes hand-curated questions with procedurally generated ones regenerated on every menu visit, filterable by category and by Warm-up / Interview / Hard difficulty.
Scatter questions render a real plot with axis values and dashed threshold guide lines - they are reading-and-counting exercises over labelled points.
How scoring works
Your ordering is scored on concordant pairs: of all pairs of options, what fraction did you place in the same relative order as the truth? A perfect ranking (100 percent of pairs) scores 3 points, 75 percent or better scores 2, 50 percent or better scores 1, and below that 0.
A round's maximum is therefore 3 points per question over 8 questions. Your best round total is stored locally and shown on the menu.
Rank by comparison
The task never asks for a probability, only an order - so compute as little as possible. For most pairs, a dominance argument settles the comparison without numbers: an event that is a strict subset of another is at most as likely; a prediction that continues a student's trend beats one that breaks it; a wider tolerance band catches more probability mass than a narrower one at the same center. Sweep the options for these free comparisons first.
When two options need numbers, compute both to one significant figure and compare - the order only flips if you are wrong by more than their gap. Reserve real calculation for the one adjacent pair that remains close after the cheap passes. Ranking n options is n-1 adjacent comparisons once you have a rough order.
Carry a small kit of distribution facts
Distribution-density and Poisson questions run on a handful of anchors. For anything bell-shaped: the mode is the most likely region, about 68 percent of mass sits within one standard deviation, 95 percent within two, and density falls off fast beyond that - so "within 1 sd of the mean" beats "between 1 and 2 sd out" beats any far-tail interval, at equal widths. An interval's probability is roughly its width times the density where it sits.
For Poisson arrivals with mean lambda, the most likely counts hug lambda (the mode is the floor of lambda), and probabilities fall off asymmetrically - slower above than a naive symmetric picture suggests for small lambda. So rank counts by distance from lambda first, and when two counts are equidistant, remember small-lambda Poisson leans toward the lower count.
For dice and cards, count outcomes over the sample space. Two-dice sums rank by number of combinations: 7 is the peak with six ways, and each step away loses one way. Card events rank by counts out of 52. These are enumeration facts - the faster you can say "ways to make it", the faster the whole option list orders itself.
Sort like an algorithm under the clock
The interface swaps adjacent items, so plan for that: find the option you are most confident is first, move it to the top, then the most confident last, move it to the bottom, and only then arbitrate the middle. Anchoring the extremes first is both cognitively easiest (extremes are where dominance arguments are clearest) and mechanically cheapest in an adjacent-swap interface.
The scoring makes partial correctness valuable in a specific way: every correctly ordered PAIR counts, so getting the extremes right earns pair credit against every other option even if the middle is scrambled. With four options there are only six pairs - top and bottom placed correctly is already five of them. When the timer is short, extremes first is optimal.
Because a timeout submits your current arrangement, never leave the list in its shuffled state while you think. Make your cheap dominance moves immediately so the standing order always reflects your best current guess; refinement can then be interrupted by the clock without catastrophe.
A worked example
Count the number of ways to make each sum, out of 36 total two-dice outcomes - not the probability itself.
More ways means more likely - order directly by the way-count, no division needed.
Three options give three pairs total, and this ordering gets every pair right for the full score.
Contrast: anchoring only the top item, leaving B and C unresolved, still bags most of the credit.
Common mistakes
• Computing exact probabilities for every option when dominance arguments (subset events, trend-following predictions, distance from the mode) settle most pairs for free.
• Leaving the list shuffled while thinking - a timeout submits whatever is standing, so make cheap ordering moves immediately.
• Ranking bell-curve intervals by their width alone and ignoring where they sit - a narrow interval at the mode can beat a wide one in the tail, and density falls fast past two standard deviations.
• Treating two-dice sums as equally likely instead of counting combinations - 7 has six ways, 10 has three, 3 has two.
• Agonizing over the middle of the order before anchoring the extremes, which is where most of the pairwise credit lives.
Why interviews test this
"Which of these is most likely?" is one of the most common probability screen formats because it tests intuition without arithmetic cover: a candidate who truly understands distributions can order outcomes faster than one who can only compute. Ranking under a clock rewards the comparison habits - dominance, mode-distance, counting ways - that interviewers probe with follow-up questions.
The pairwise scoring mirrors how these answers are judged in a room: a mostly-right ordering with a defensible mistake reads far better than a refusal to commit, and knowing which comparisons you are sure of is itself the calibration being tested.
Play Likelihood Ranking on Outcry
Likelihood Ranking is free to play on Outcry, in the Drill Lab section, and every run is timed and scored. Read the guide once, then play Likelihood Ranking and check your score against the strategy above. The guide book has a written guide for every other game, and the practice hub and mock assessments put the same skills under a real screen's clock.